Track Your Savings - New Statistics Page 📊
Ever wonder how much money you're actually saving with batch translation? How many API calls you've avoided? Whether your usage is trending up or down?
We hear you. Numbers matter. Seeing your savings matters even more.
That's why we built the Statistics Page - your personal dashboard showing exactly how batch translation impacts your wallet and usage patterns.
Why Statistics Matter 💡
You've enabled batch translation (smart move!). But without data, you're flying blind:
- 🤔 "Am I really saving that much?" - No way to know
- 📉 "Is my usage increasing?" - Just a guess
- 💰 "How does this month compare?" - Pure speculation
The Statistics Page changes everything.
Knowledge is Power: Real data helps you optimize your settings, understand your patterns, and prove the ROI of batch translation.
What You'll See 👀
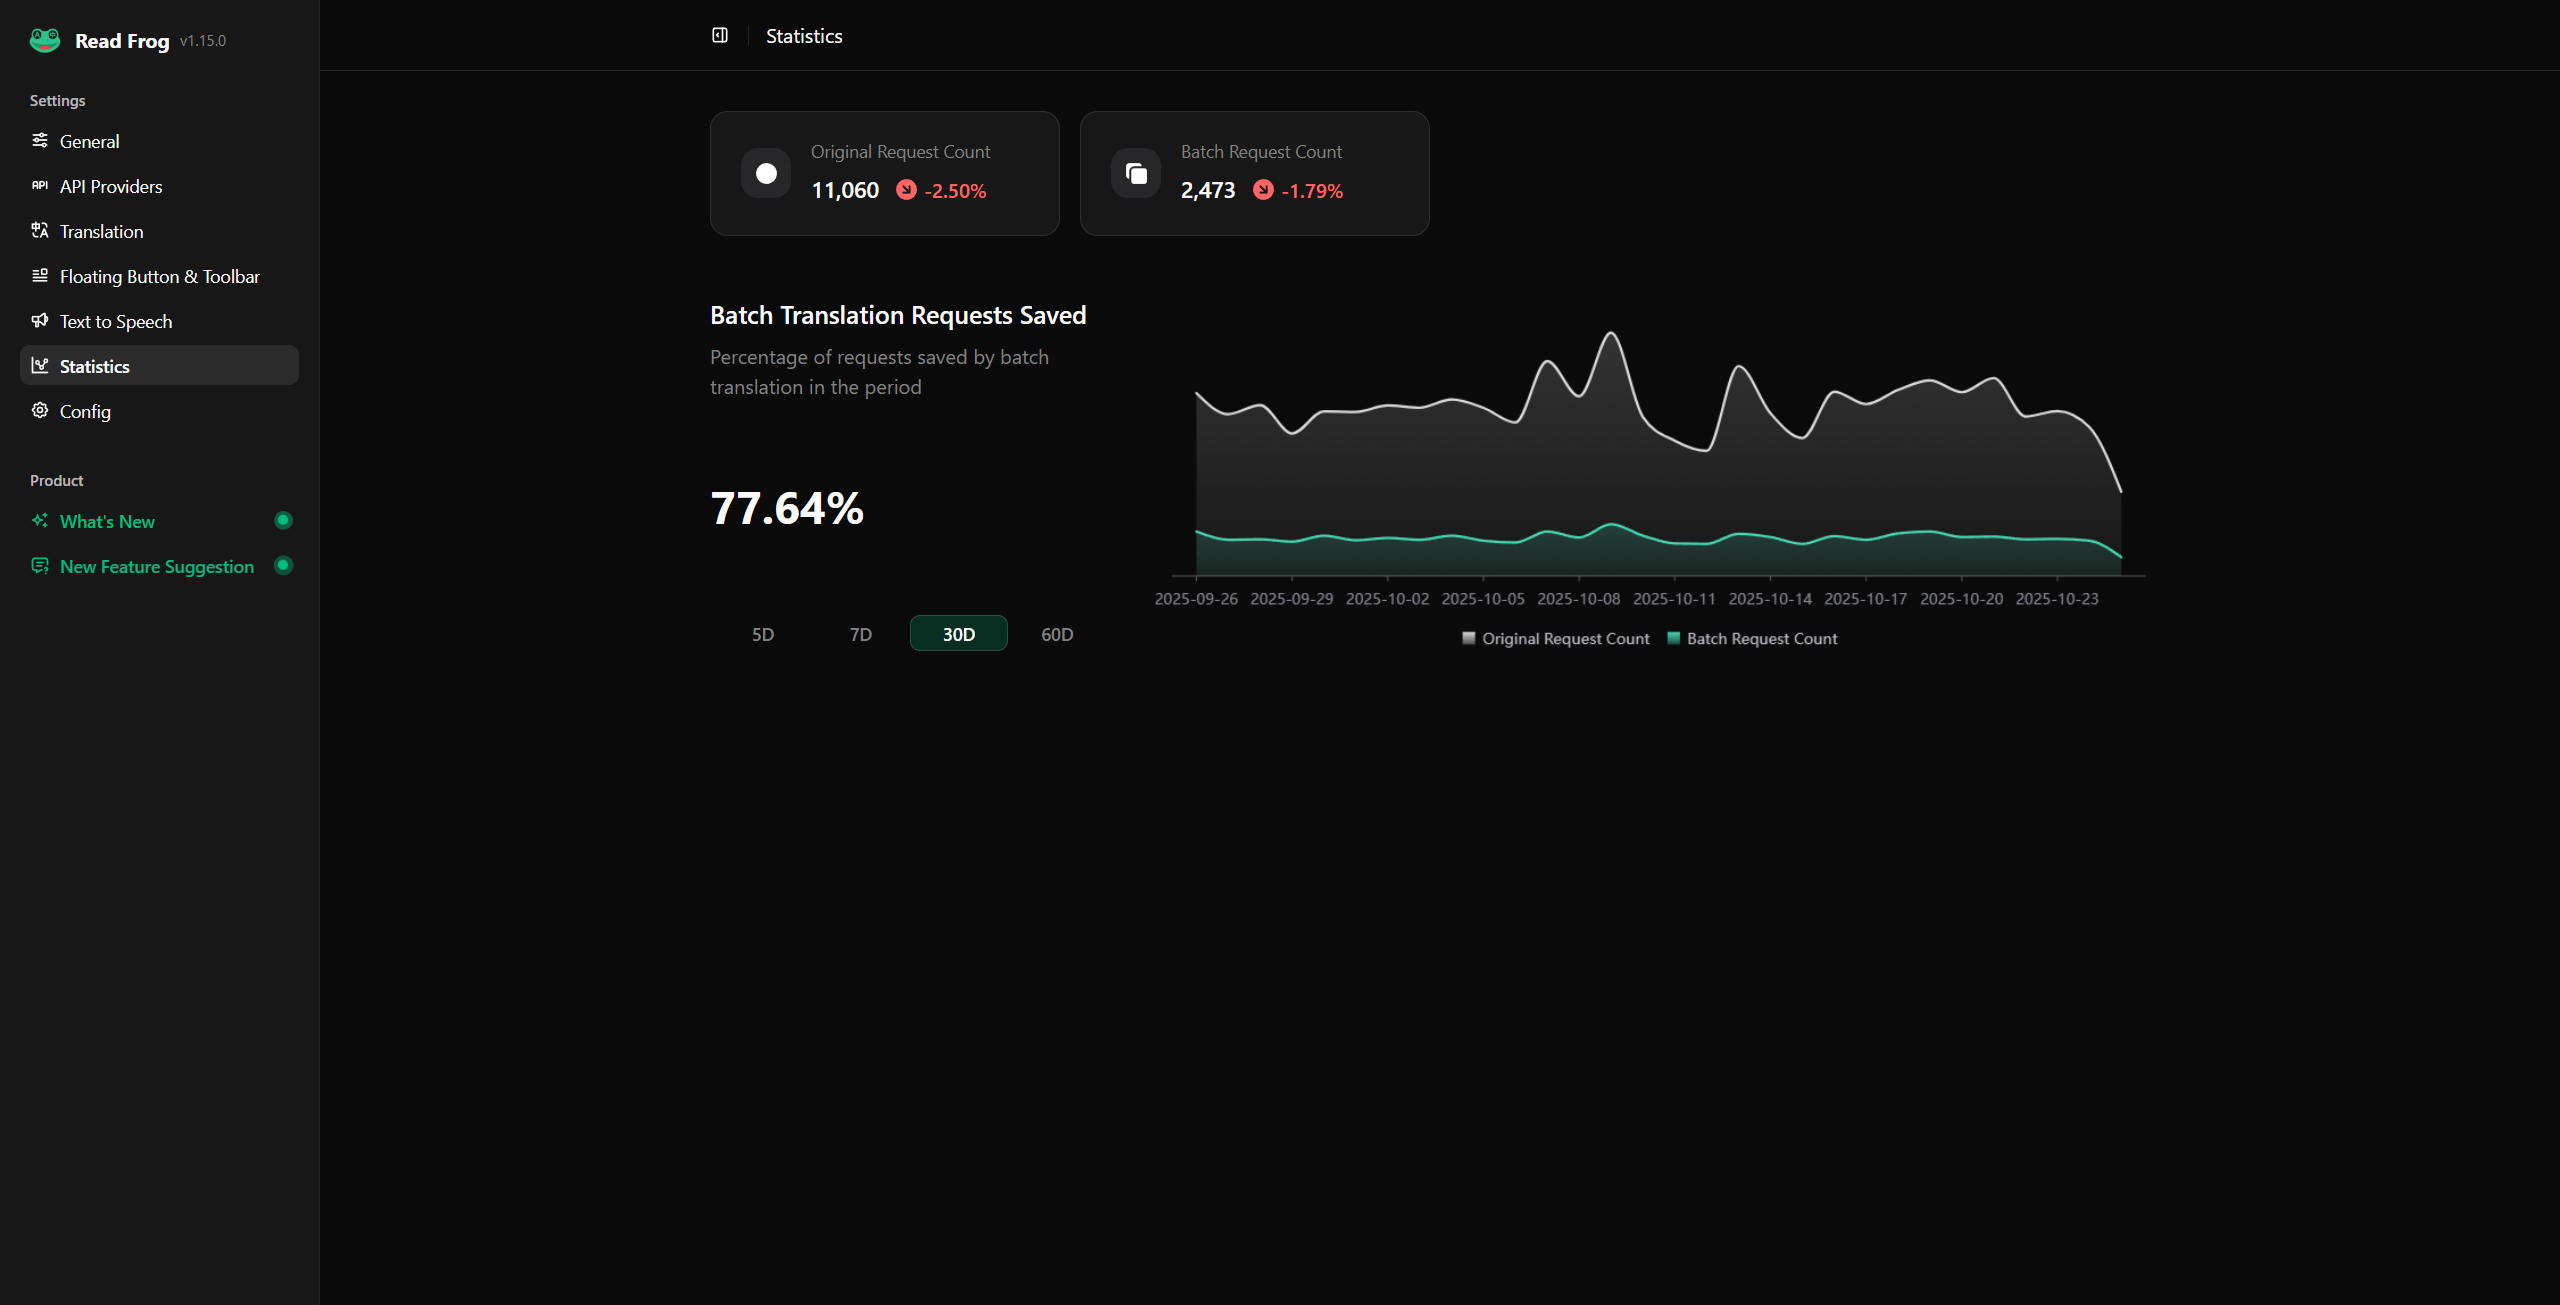
At a Glance Metrics
Four powerful metric cards greet you the moment you open Statistics:
| Metric | What It Shows | Why It Matters |
|---|---|---|
| Original Request Count | How many API calls you would have made | Your baseline without batching |
| Batch Request Count | How many API calls you actually made | Your real API usage |
| Requests Saved | The difference (your efficiency gain) | Proof of savings |
| Trend Indicators | ↗️ Increase or ↘️ Decrease from previous period | Spot patterns instantly |
Each card shows comparison with the previous period - so you can see if things are getting better or worse at a glance.
Green arrows are your friends: ↗️ on "Requests Saved" means you're getting even more efficient!
Visual Insights 📈
The Savings Chart
Numbers are great. Charts are better.
Our interactive chart visualizes your batch translation activity over time:
- 📅 Flexible time periods: View 5, 7, 30, or 60 days
- 🎨 Theme-aware: Beautiful in both light and dark mode
- 📊 Two data series:
- Original Requests (what you would have paid)
- Batch Requests (what you actually paid)
The gap between the lines? That's your savings.
Real-World Example
Imagine you're a student translating research papers:
| Period | Original Requests | Batch Requests | Saved | Percentage |
|---|---|---|---|---|
| Week 1 | 450 | 85 | 365 | 81% |
| Week 2 | 520 | 98 | 422 | 81% |
| Week 3 | 380 | 72 | 308 | 81% |
Consistent 81% savings = You're using batch translation effectively!
Spot Issues Early: If your savings percentage suddenly drops, it might mean:
- Your batch settings need adjustment
- You're translating different content types
- Time to optimize your configuration
How to Access Statistics 🚀
Super simple:
- Open Read Frog settings (Click extension icon → Options)
- Navigate to "Statistics" in the sidebar
- Boom! Your dashboard awaits
That's it. No setup required. We've been tracking your data automatically.
Dive Deeper into Your Data 🔍
Compare Time Periods
Toggle between different views to match your analysis needs:
| View | Best For |
|---|---|
| 5 Days | Spotting recent changes |
| 7 Days | Weekly patterns (default) |
| 30 Days | Monthly trends |
| 60 Days | Long-term analysis |
Understand Your Savings
The savings percentage prominently displayed tells you:
Savings % = (Original Requests - Batch Requests) / Original RequestsTranslation? If you see 75%, you're making 4 API calls instead of 16 for the same work.
Typical Savings Range: Most users see 60-85% savings. If you're below 50%, consider increasing your batch size in settings.
Perfect For These Scenarios ✨
📚 Budget Tracking
Monthly API budget of $20?
Check Statistics to see if you're on track or need to adjust usage.
📊 Usage Optimization
Not sure if your settings are optimal?
Compare different periods. Experiment with batch sizes. See what works.
🎓 Academic Research
Translating dozens of papers?
Track your efficiency. Show your advisor how you're managing resources smartly.
💼 Business Users
Need to justify the tool to your team?
Hard numbers showing 70%+ cost reduction make compelling cases.
What the Numbers Mean 💭
Let's break down a real example:
Your Statistics Show:
- Original Request Count: 500
- Batch Request Count: 100
- Requests Saved: 400
- Average Savings: 80%
What This Means:
If your provider charges $0.01 per request:
| Scenario | Cost |
|---|---|
| Without Batching | 500 × $0.01 = $5.00 |
| With Batching | 100 × $0.01 = $1.00 |
| You Saved | $4.00 (80%) |
Scale this over a month of heavy usage? Savings add up fast.
Pro Move: Screenshot your statistics before and after adjusting batch settings to see what configuration gives you the best results.
Privacy & Data 🔒
Your statistics data is:
- ✅ Stored locally in your browser (IndexedDB)
- ✅ Never sent to servers - completely private
- ✅ Automatically maintained - old records are cleaned up periodically
- ✅ Lightweight - minimal storage impact
Your data. Your browser. Your control.
What's Next? 🔮
The Statistics Page is just the beginning. We're exploring:
- 📊 Cost calculators - Input your provider pricing, see exact dollar savings
- 🎯 Provider breakdown - See savings by different API providers
- 📈 Export data - Download your statistics for external analysis
- 🏆 Efficiency scores - Gamified insights to optimize your usage
- 📅 Custom date ranges - Pick any specific period to analyze
Shape the Future: What statistics would you find valuable? Share your ideas - user feedback drives our roadmap!
Start Tracking Today 📊
Ready to see your savings in action?
- ✅ Update to Read Frog 1.15.0+
- ✅ Open Settings → Statistics
- ✅ Watch your efficiency in real-time
Note: Statistics begin tracking from the moment you update. Historical data before this version isn't available (but future data will accumulate automatically).
Real User Impact 🌟
Here's what understanding your statistics enables:
Before Statistics Page:
- ❓ "I think batch translation helps..."
- 🤷 "Not sure if my settings are right"
- 💸 "Hope I'm saving money"
After Statistics Page:
- ✅ "I'm saving 78% on API costs"
- 🎯 "My optimal batch size is 1200 characters"
Knowledge transforms hope into certainty.
The Bottom Line 💰
Batch translation saves you money. The Statistics Page proves it with hard data.
No more guessing. No more wondering. Just clear insights into how efficiently you're using Read Frog.
Go check your stats. You might be surprised how much you're already saving. 📊
Happy tracking! 🐸
P.S. - Found a cool pattern in your statistics? Share it with the community - we love seeing how people use Read Frog!
Written by
taiiiyang
At
Fri Oct 24 2025
Extension Version
1.15.0